
The Prospa SME Summer Industry Outlook shares insights on how Australian small businesses used finance over the summer. It compares data from December to February in FY26 with the same period the previous year.
The report uses Prospa’s lending data and SME research from YouGov to show cash flow usage and how borrowing changed across states, industries, and how businesses used their funds. It also tracks changes in average loan sizes, loan volumes, and business revenue.
The report explains how SMEs responded to summer trading conditions. It shows where funding activity increased or decreased, how borrowing patterns changed, and how these trends varied by region and sector.
Key Pullout Metrics
Executive Summary
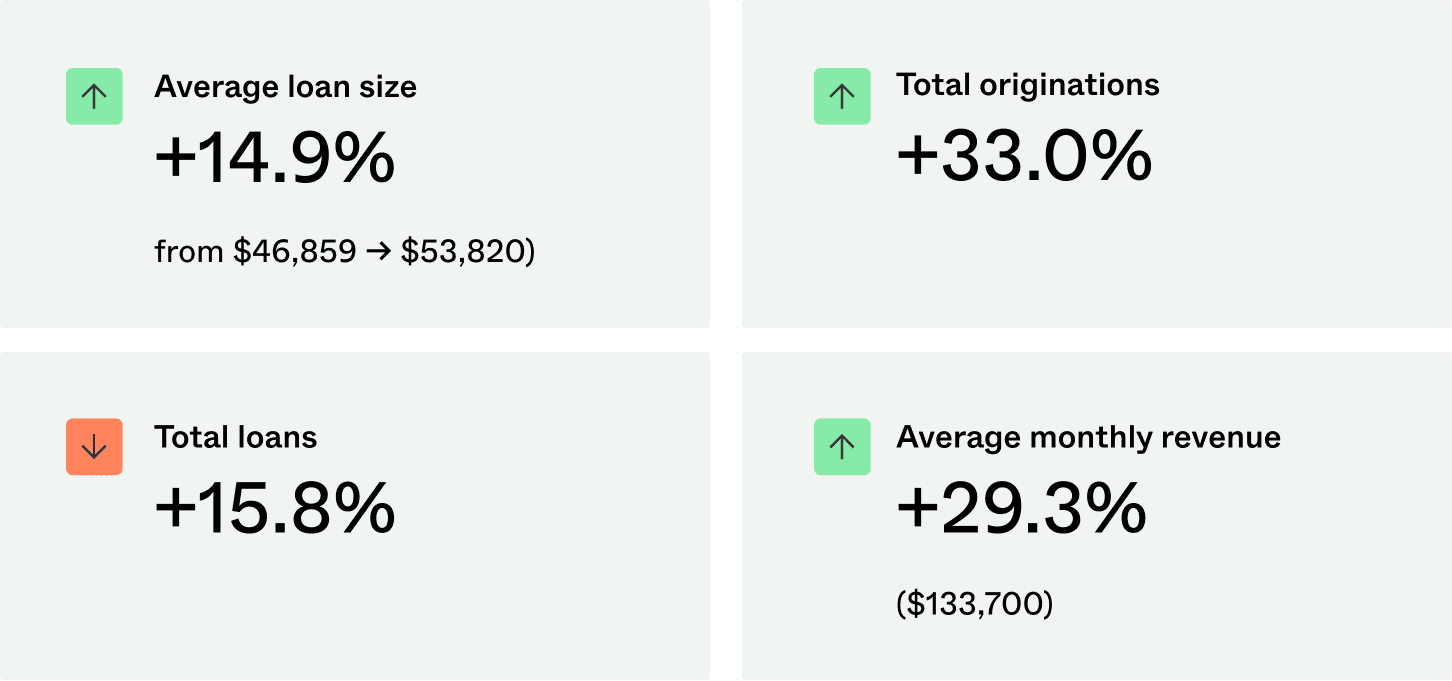
The summer of FY26 was characterised by an increase in both the number and size of funding decisions. Across December to February, total loan volumes increased by around 15.8%, while total funding generated rose 33.0%, lifting average loan size by 14.9%.
This indicates that more businesses accessed funding over the summer, and they did so for larger amounts per decision. In addition to overall increases, funding generated for growth purposes increased over the period. Funding used for Expansion and Growth rose 19.8%, despite a reduction in the number of growth-related loans taken out. Meanwhile, cost-driven funding became more pronounced. Funding used to pay suppliers increased 66.6% year on year, even though the number of loans to pay suppliers declined. Funding used for Working Capital also increased, despite fewer Working Capital loans being written.
Alongside these funding trends, average monthly revenue across Australian businesses increased 29.3%, indicating improved trading conditions. However, the way funding was directed suggests that higher operating costs and cash flow needs continued to influence how businesses used finance over the summer.
Commentary from Prospa
This summer period played out against a more uncertain global backdrop. International instability added volatility to costs, supply chains and sentiment, and for many small business owners, that required sharper judgement and tighter cash flow control. Fuel, freight and input prices were unpredictable, but businesses stayed active and continued to make clear funding decisions rather than pulling back.
What stands out is not retreat, but recalibration. Businesses continued to access funding, often in larger amounts, with greater clarity of intent. The investment was focused on safeguarding operations, managing supplier commitments, and maintaining momentum in core parts of the business before pursuing expansion. Growth hasn’t stopped – it has become more deliberate, reflecting a measured balance between opportunity and external uncertainty.
This behaviour speaks to the adaptability of the SME sector. Rather than postponing decisions, owners are sequencing investment more carefully, prioritising stability while still investing in the parts of their business that pursue growth. In a period where global events increasingly impact day-to-day trading, this pragmatism is a positive signal. It shows that small businesses are responding to pressure by strengthening their foundations and positioning themselves for the seasons ahead, rather than standing still.
 |
“What we are seeing is hesitation, not apathy. Small businesses are still investing, they are just being smarter about timing and order.” – Beau Bertoli, Prospa Co-Founder & Chief Revenue Officer |
Cash flow Confidence Snapshot
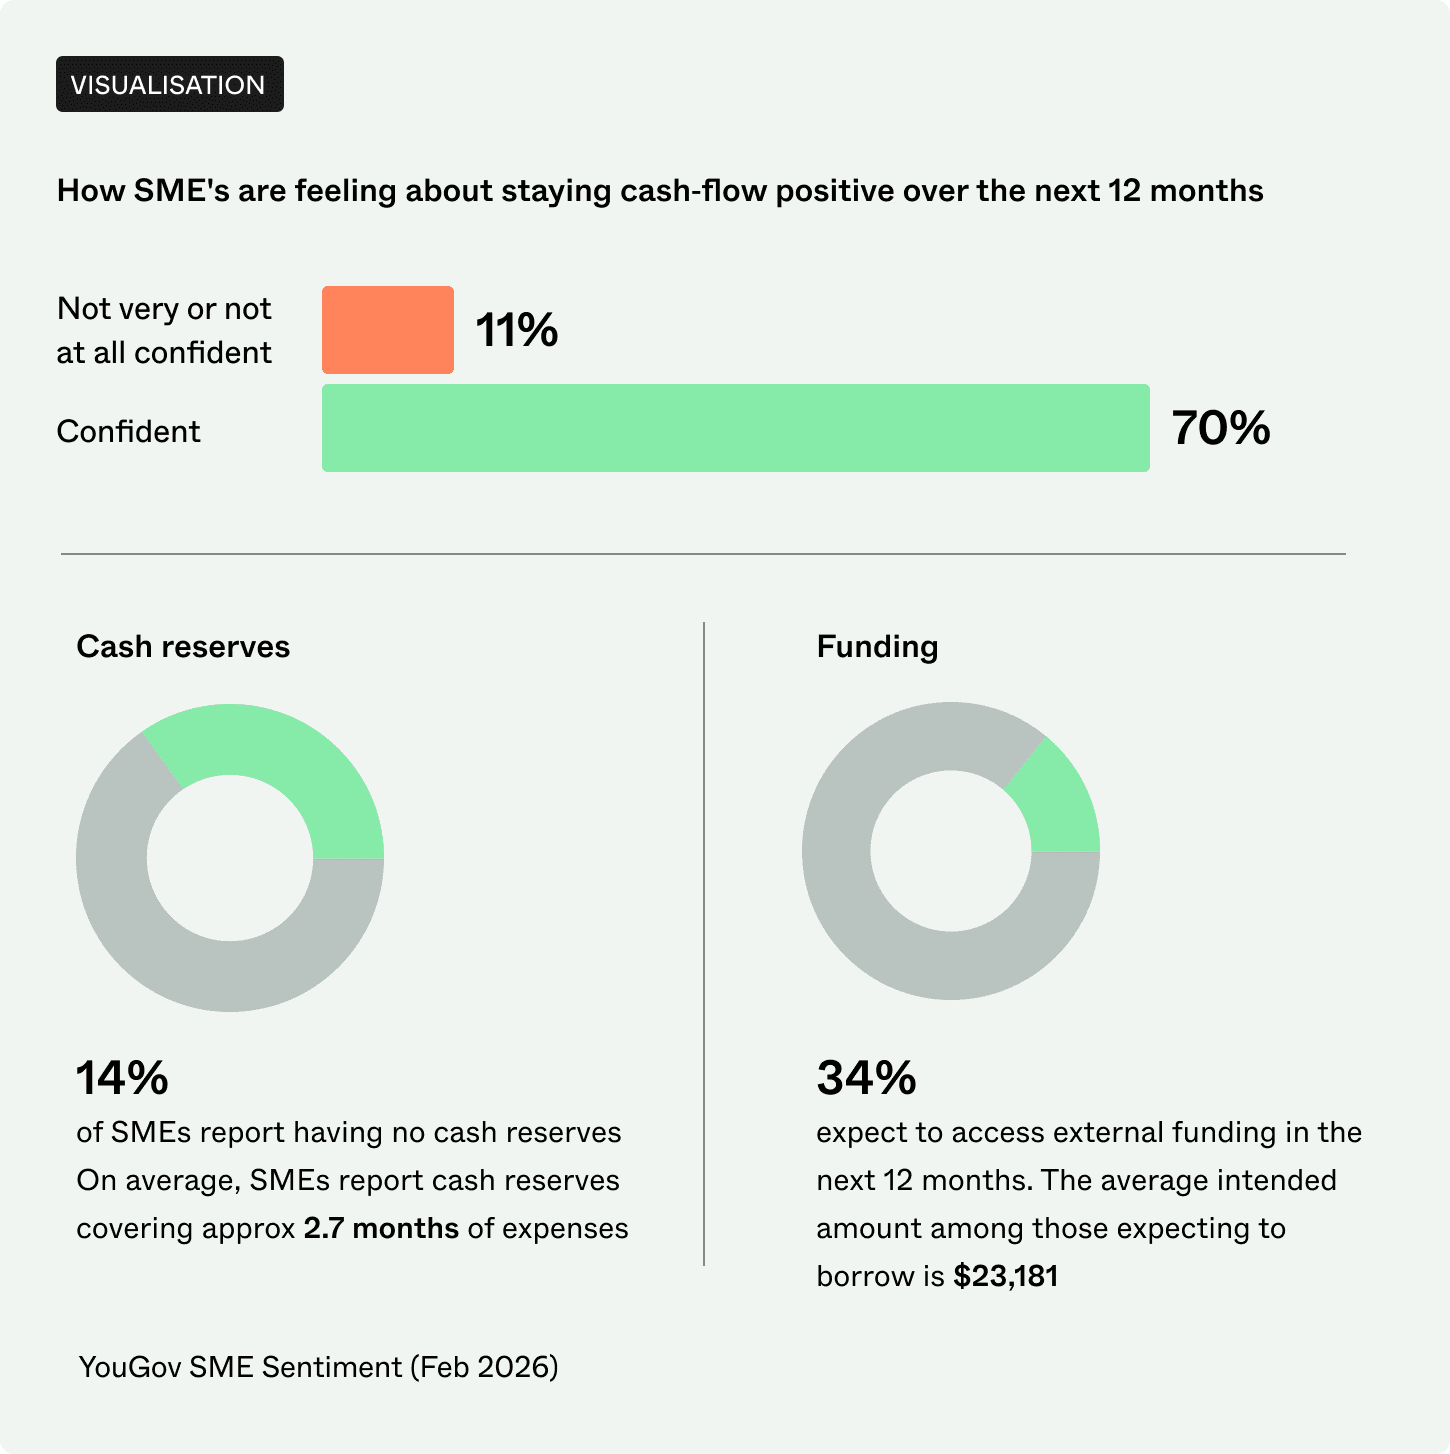
- 11% feel not very or not at all confident that they will remain cash flow positive in the next 12 months . 70% of SMEs feel confident they will stay cash-flow positive over the next 12 months.
- 14% of SMEs report having no cash reserves. On average, SMEs report cash reserves covering around 2.7 months of expenses.
- 34% expect to access external funding in the next 12 months. The average intended amount among those expecting to borrow is $23,181.
Top Signals
 |
Supplier costs spiked
Funding used to pay suppliers increased 66.6% nationally, with Victoria (+127.6%) and Queensland (+120.2%) the sharpest movers. |
 |
Growth returned selectively
Funding used for Expansion and Growth rose 19.8% nationally, led by South Australia (+299.2%), despite fewer growth loans overall. |
 |
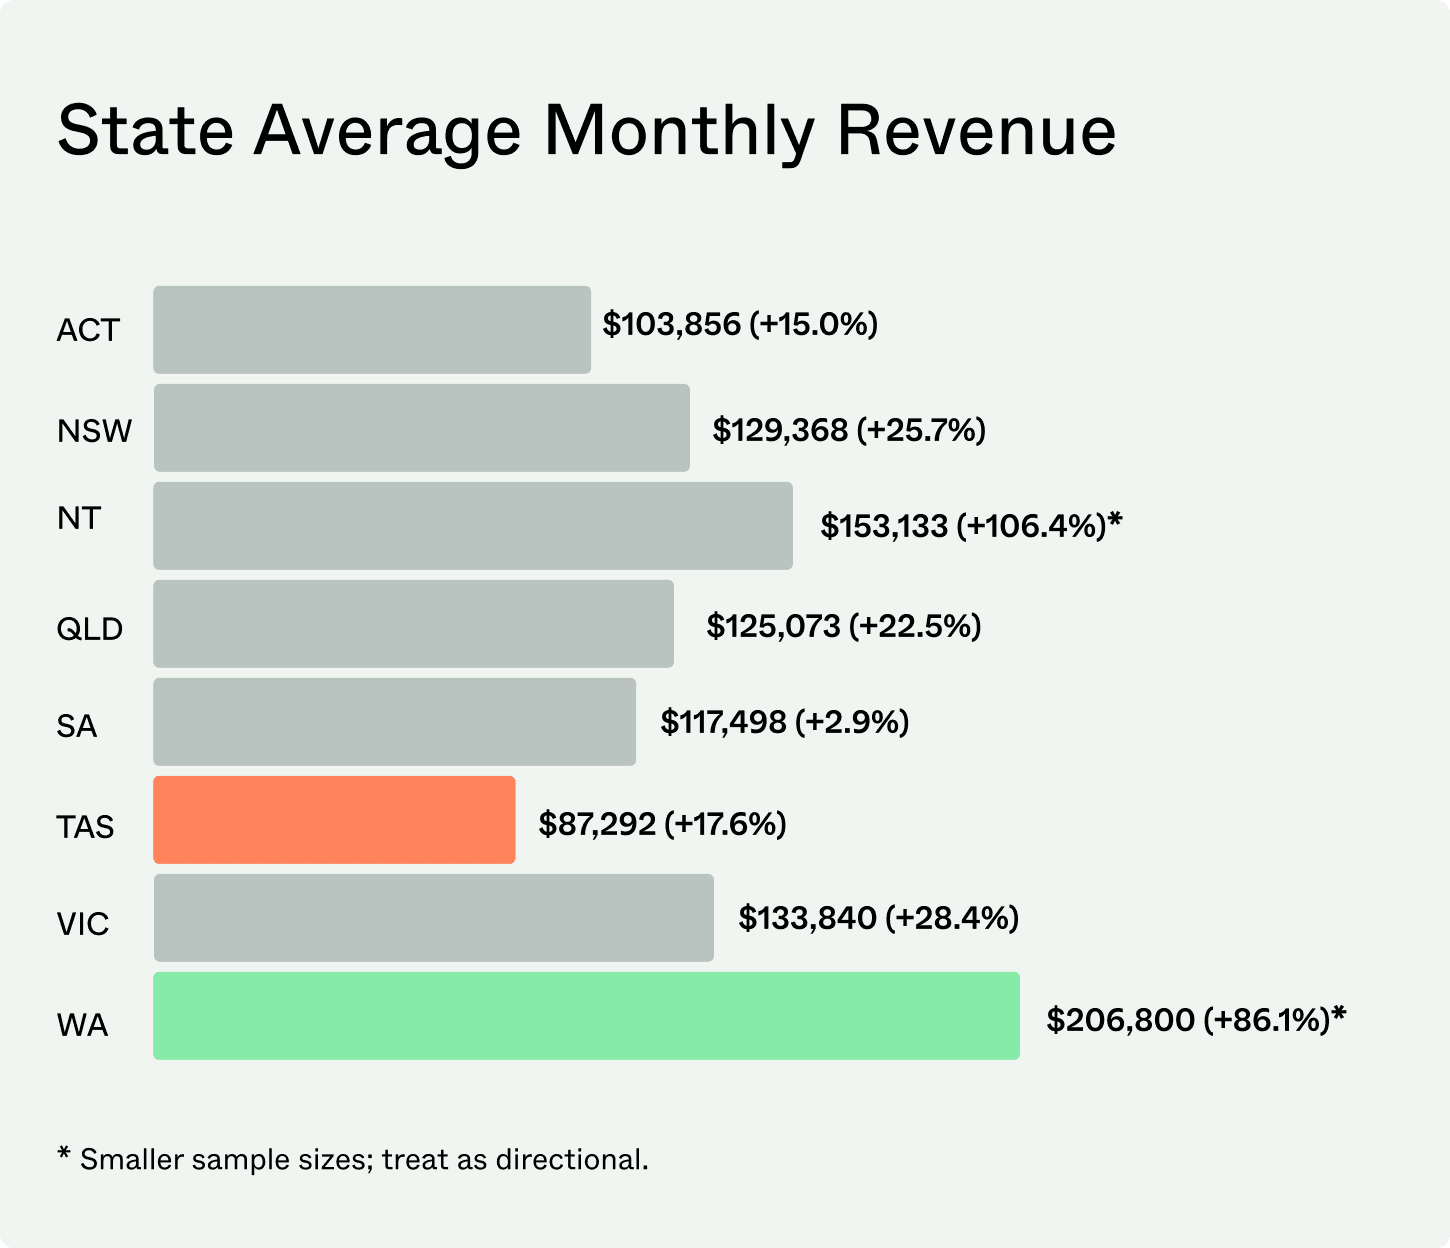
Average monthly revenue by state
Comparison of average monthly revenue across Australian states, highlighting Western Australia as highest and Tasmania as lowest. |
State Insights
New South Wales
NSW continued to show one of the strongest growth signals nationally. Funding generated for Expansion/Growth increased 12.0%, while funding used for Working Capital rose 9.6%, even though loan volumes in both categories declined year-on-year.
Victoria
Victoria’s defining summer story was cost pressure. Funding used to pay suppliers increased 127.6%, making it the most pronounced supplier-driven increase of any state. Funding used for Working Capital also rose 20.8%, despite fewer Working Capital loans being taken out.
Queensland
Queensland recorded strong cost-driven movement. Funding used to pay suppliers increased 120.2%, while funding used for purchasing inventory declined 26.5%, even as inventory loan volumes fell more sharply (-49.4%). This points to higher dollar values per inventory loan when funding was accessed.
Western Australia
WA leaned into liquidity support over summer. Funding used for Working Capital increased 26.1%, while loan volumes were broadly flat (-1.6%), indicating larger average Working Capital loan sizes.
South Australia
South Australia showed the clearest pivot toward growth. Funding generated for Expansion/Growth surged 299.2%, while funding used for Working Capital declined 10.6%, marking a shift away from defensive funding and toward investment-led borrowing.
ACT
ACT experienced a softer summer. Funding generated for Expansion/Growth declined 32.8%, while funding used for Working Capital fell 21.5%, reflecting smaller and more constrained funding activity.
Tasmania
Tasmania recorded reduced activity overall. Working Capital loan volumes declined 29.4%, while total Working Capital funding fell 12.2%, indicating fewer and smaller cash flow-related funding decisions.
Northern Territory
NT movements were more volatile due to a small base. Funding used for Working Capital increased 155.1%, alongside a 23.1% rise in Working Capital loan volumes. Results should be treated as directional only.
Industry Insights
Top 5 Industry Signals (Summer FY26)
Building & Trade
- Funding generated +22.9%, with average loan size +44.9%.
- Funding generated for Expansion/Growth +114.5%, alongside Working Capital +16.4%.
Transport
- Funding generated +60.5%, driven by a 90.6% increase in funding used for Working Capital.
- One of the clearest liquidity-led funding shifts of the summer.
Professional Services
- Funding generated +23.5%, with average loan size +35.9%.
- Funding used to pay suppliers +57.2%, alongside Expansion/Growth +18.8%.
Financial Services
- Funding generated for Expansion/Growth +12.0%, with average growth loan size +57.7%.
- Indicates fewer but significantly larger growth-focused funding decisions.
Primary Industry
- Funding generated +399.5% off a small base.
- Loan volumes +91.7% and average loan size +160.6%, the sharpest proportional shift of any sector.
Industry Summary & Storylines
During summer FY26, industries saw fewer funding decisions but significantly larger funding amounts per loan. Many active sectors experienced funding growth despite lower loan volumes, indicating that businesses were more selective about borrowing and required greater capital when they did.
Cost pressure and liquidity needs remained central. Transport and Building & Trade stood out for strong increases in funding used for Working Capital, reinforcing the importance of cash flow support through peak trading months. Professional Services also recorded a sharp rise in funding used to pay suppliers, alongside higher growth funding, showing a blend of operating cost management and selective investment.
Growth activity returned unevenly. Building & Trade and Primary Industry saw the largest increases in funding for expansion and growth. In contrast, Financial Services experienced growth funding primarily through larger average loan sizes rather than higher volumes. This suggests growth was driven by larger individual funding decisions rather than widespread expansion.
Closing
Summer FY26 saw Australian small businesses remain engaged and active. Loan volumes increased, and total funding and average loan sizes rose, pointing to both higher participation and larger funding decisions when businesses chose to borrow.
Revenue indicators improved across the dataset, but funding patterns show that cash flow pressures and operating costs continued to play a central role in how businesses used finance over the summer period.